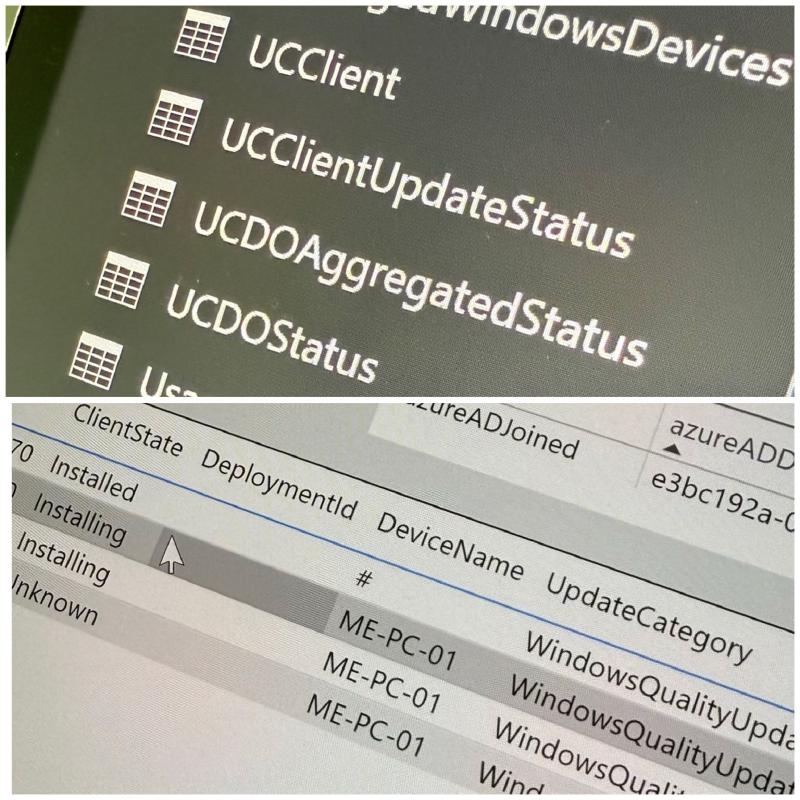
Intune + Graph + Log Analytics Workspace + PowerBI = 🤩🤯 SUPER reporting and dashboards!
Those who are used to ConfigMgr reports might have a lot of fun with the ingredients mentioned above!
Intune and Windows Update for Business data integrated with Log Analytics Workspaces are a goldmine of information. Sometimes, however, it doesn’t seem that way. This is because the native workbooks of the Intune portal, in some situations and for some very large organizations, can be not very specific.
With a bit of configuration, queries, slicers, and tables, PowerBI allows you to create amazing and very detailed dashboards with Intune data.
I am working on it these days and it is a completely new world opening up.
Thanks to Marco Saracco for inspiring me on this topic.
Your IT Specialist,
Riccardo
